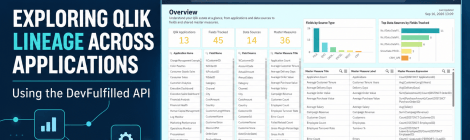
A customer recently asked a deceptively simple question: “How can we find every Qlik application that uses a particular field or calculation?” Qlik already provides strong lineage and impact-analysis capabilities, […]

A customer recently asked a deceptively simple question: “How can we find every Qlik application that uses a particular field or calculation?” Qlik already provides strong lineage and impact-analysis capabilities, […]

Version control has always been a slightly awkward subject in Qlik Sense. Although now, we can export application metadata, put it into Git and build a history of what changed […]

Hello, Every now and then I find myself writing something a little more personal than technical, and this is one of those posts. For over twenty years I’ve worked with […]

Hello everyone, Happy New Year to you all. For the past few days, I’ve been scratching around various documentation and videos surrounding Qlik Sense SaaS (Cloud) to retrieve data from […]

Accessing the Qlik API using the Python requests library quite straight forward although soon some code can start to become complex. Such as using OAuth to connect and if you’re […]

In order to manage multiple tenants or complex Qlik Sense SaaS platforms soon you will find you want to automate a lot of your administrative tasks. Taking the Qlik CLI […]

Qlik-CLI allows you to manage your Qlik environment using the command line. This in turn makes it easier to automate certain tasks such as: Import, export, publish, and republish apps. […]

In today’s data-driven business landscape, the ability to extract valuable insights from vast amounts of information is crucial for staying ahead of the competition. That’s where business intelligence (BI) tools […]
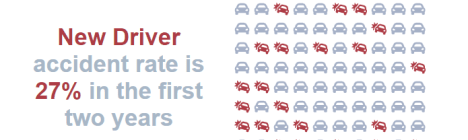
Proud to announce I’m publishing my first Qlik Sense extension. Is it a grid chart or a waffle chart? https://github.com/RichardPearce60/sense-svg-grid-chart This isn’t my first extension, over the past few years […]

D3 Scales make creating chart axis simple by passing the extent (min / max) values to the scale.domain. Unfortuanly our values mean axis extremes aren’t always “nice”, they are absolute […]

