Hello,
Thanks for visiting my Blog. My name’s Richard Pearce and I’ve been working with Business Intelligence for over 20 years and absolutely love this type of work.
I read recently that creating dashboards is akin to being an architect or engineer. The technical knowledge you need and the creative aspect make for very interesting work. Of course, like many careers, it can be challenging although with a good support network help is never too far away.
Hence this blog. Somewhere to store insight and technical examples I develop along the way (sometimes with a little help from my friends who I will be sure to mention)
If you wish to ask me anything or connect you can reach out to me here, twitter @richardpearce60, on the Qlik Community, or on linkedin.
|
|
|
|

Beginnings
My first encounter with dashboards was in 1994.
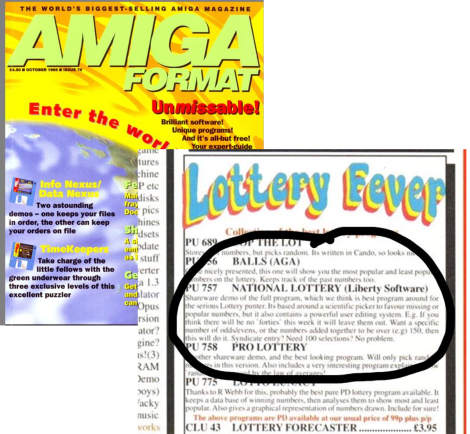
The National Lottery had just started and the nation was gripped with lotto fever. Back then I was 16 years old and, as a hobby, developing games and tools on the Commodore Amiga (using Amos the Creator). I had a crack at developing a ‘number picker’. Not a simple random number generator but a scientific program that stored a history of the numbers drawn so far to predict the next likely outcome.
Needless to say, I never got all six numbers although I did better than most – for those interested the chance of getting three numbers (£10 win) is approx. 1 in 50 using a random number generator. My software could pick three correct numbers once in every 20 attempts…. so still losing money.
An offshoot of the project was developing statistics on the lottery itself and the performance of my software. My first dashboard was created. Unfortunately, I don’t have the program anymore (or an Amiga). However, someone out there may still have a working copy as it was distributed through Amiga Format magazine (The National Lottery – Liberty Software).
Skip forward a few years and I was working with a large media company. They had a challenge connecting two systems together to generate reports. They were using excel workbooks with pivot tables. Seeing the issue I bought a number of books and learned Visual Basic. Due to my history of software coding whilst I was younger I was already halfway there and within a short amount of time I’d written the code required and the systems were linked (and I was hooked)
Over the next 15 years, I worked for a number of prominent organizations (banking, manufacturing, and health care). I moved away from development and into leadership roles and project management.
I then found myself as a stakeholder in a Data Warehouse project. The initial scope was to build a SQL database to aid the reporting function. As a stakeholder, I asked for the scope to include a dashboarding tool like Business Objects (as I’d had some experience using this software). subsequently, the scope was changed to include the procurement of a new system…..
Soon afterward I moved roles and now on the project team became responsible for the delivery of the database including the new tool I requested.
I began speaking with the main vendors of dashboarding tools and organized meetings with them to review and compare their products. Skip forward again and I’d purchased QlikView for the organization.
The challenge now was we had a great tool although no in-house experience on how to use it. Not for the first time I got the books together and began to learn.
In my previous role leading their Analyst Team, I’d already worked with the end users and gathered their requirements and I was fortunate to have a green field with QlikView. Server sizing, installation, development and production were built up from scratch.
Now my focus is on Qlik development (QlikView and Qlik Sense) as a consultant and I’m enjoying working with new organizations and helping them get the most out of the Qlik analytics platform.
In 2016 I joined the QlikDevGroup leadership team in London. In this role, I organise regular events where developers can come for free in the evening, Eat Pizza, Drink Beer and hear all about Qlik’s latest developments and ideas from a whole host of speakers from around the world (http://qlikdevgroup.com/london-home/)
In 2017 I joined the Qlik Luminary program and was successful again in 2018, 2019, and 2020.
Richard


Hi,
Can you please do more How To youtube videos. They are really good and that’s how I found you.
LikeLike
Hi Christina. Thanks for the feedback. I am planning to do more blogging and videos very soon. Richard.
LikeLike
Really great blog and love the passion for Qlik! Also congrats on being named a Qlik luminary.
My company Narrative Science created Narratives for Qlik, an extension powered by AI that transforms Qlik Sense visualizations into powerful narratives that unlock hidden insights and accelerate smart data discovery for dedicated users like you. Given your great expertise, would you be open to sharing your quick thoughts about it and new capabilities we are thinking to improve the product’s value? Feel free to shoot me a note if so!
LikeLike
Hi Jamie. Thanks for the message. I’ve seen your Narratives extension in demos before and was very impressed although I’ve not used the extension yet in an actual deployment. Licensing costs have put off customers so far. Not sure what value I can add but feel free to DM me via LinkedIn. Richard.
LikeLike