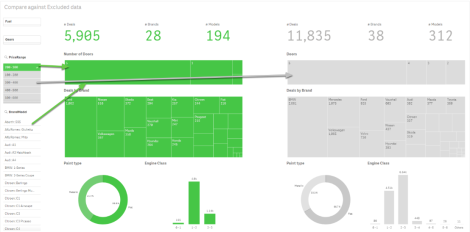
Firstly I’ve got to say the inspiration for this blog post came from a post by QlikShow – Grey? So What?. Here Patrick Tehubijuluw showed a great visualisation technique which can be used in either QlikVeiw or Qlik Sense to display what isn’t selected in charts, in other words the Grey values not associated to you current selections.
This screen shot from Patricks blog shows how powerful this can be and I was keen to use this approach in my next development. Unfortunately Patrick didn’t say how he achieved this so rather than asking I though it would be fun to try and work out how to do it myself.
I think looking for answers yourself will help develop your skills. You may find yourself investigating areas which may not lead to the right answer, this is okay as you still will learn about functions in more detail by doing so.
Here I run through my steps to a simple solution, maybe there’s a better one out there? If you know of one please let me know in the comments below.
I had QlikView and searched though the chart to see if there was an simple tick box to achieve this. Nothing was found although that was okay, I was sure even if QlikView did this simply Qlik Sense may not have the same option so Set Analysis seemed like a better option.
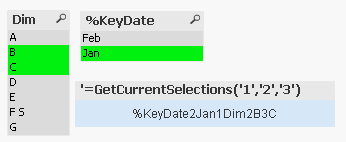
Initially I looked at the GetCurrentSelections() function and even though I created myself a big headache I did manage to find a solution (of sorts). The function had a number of parameters which I don’t recall using before (normally I only ever used that function in a chart header or something where people could copy the image to PowerPoint for example). The extra functions denote characters used between records, separate records and separate values.
Here I use 1, 2 and 3 in the function to show where these are inserted into the returned results.
This helped me build up a string changing the 1, 2 and 3 to values that would be used as set analysis
replace(
    replace(
        replace(
            GetCurrentSelections( chr(39)& '},','=-{' & chr(39) ,chr(39) & '|' & Chr(39)   ) & chr(39) &'}'

        ,',','')
    ,'}', '},')

,'|',',')
Okay quite complex to look at although
GetCurrentSelections( chr(39)& ‘},’,’=-{‘ & chr(39) ,chr(39) & ‘|’ & Chr(39) ) & chr(39) &’}’
returns
%KeyDate=-{‘Jan’},Dim=-{‘B’|’C’}
The replace functions around it sort out the commas and get it all perfect. Note – I also had to chop off a final comma using a left command!
In the Set Analysis I use the =- operator to select excluded. Using dollar expansion the expression is parsed to
Sum({1 < %KeyDate=-{‘Jan’},Dim=-{‘B’,’C’} >} Value)
This takes the full set of data and shows results where %KeyDate doesn’t equal Jan and Dim doesn’t equal B or C. Happy days, I got the function to work although it still wasn’t perfect. When using multiple dimension values the intersection wasn’t as I wanted it to be, plus thinking about a real world question I would want to keep users selections such as date.
The question/Selection may be in 2016 what products were sold in the North. Now (in my mind) the alternative result to that would be what products were sold in 2016 anywhere except the north. If you had data going back 10 years you wouldn’t want to see data from all the years but not in the north as that’s not a great comparison. So I was stuck and needed to rethink my approach.
I’m sure some of you are already shouting at the screen. Why don’t you just use {1-$}???
Well if I only had you here for the first hour or two I was trying to solve this problem I would have bought you a drink. Simple thing is I forgot about it….. I’m so used to using Set Analysis as I’ve describe above the simplest solution just wasn’t in my mind from the outset and I ended up going down a different path. Now, as I’ve mentioned earlier that’s okay as I’ve practiced some skills and learned more about a function I do use from time to time…. So anyway, on with the solution.
Sum({1-$} Value) takes the full data set (1) and removes the current selection ($). This is far more elegant, using the power of the Qlik Engine and works for multiple dimension selections giving you the proper intersection.
I then have to reduce the selection further to only include dates selected in by the user. In Set Analysis you have a P argument representing the element set of possible values of a field.
sum({-1<%KeyDate-=P(%KeyDate)>} Values)
Here I’m reversing (-=) all the possible value of %KeyDate which would give me Jan values in my limited dataset. The (-1) reverses that back to Jan values which is what the user has selected. Add that to the original Set Analysis.
sum({1-$-1<%KeyDate-=P(%KeyDate)>} Values)
You now return all the values for the selected time period that are not selected by the user!
It’s worth noting that %KeyDate is the field I would use to connect the calendar to the FACT data and I wouldn’t allow the user to make selection on that field!
I hope this was helpful. I mentioned before I’m sure there may even be a simpler way to do this in QlikView or Qlik Sense. If you know of any please comment below!
Take care
Richard


I think “sum({1-$-1} Values)” is equivalent to “sum({1-$} Values)”
LikeLike
I think it is although during tests I seem to need the additional -1 so I could discount the possible dates from the selection.
LikeLike
ah, great everything in lt and gt brackets gets eaten by the blog monster.
perhaps like this: sum({1 < %DateKey=P(DateKey) > -$}Values)
LikeLike
:-). Thanks. That makes sense too. The last challenge was very much trial and error to get it working.
LikeLike
close, but I forgot a % character
so… this:
sum({1-$-1< %DateKey=-P(%DateKey)>}Values)
would be equivalent to:
sum({1<%DateKey=P(%DateKey)>-$}Values)
LikeLike
Pingback: 5 Qlik blogs you should check out | OptimalBI·