The Challenge
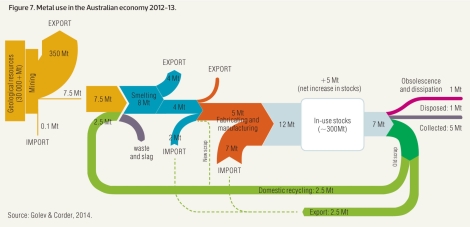
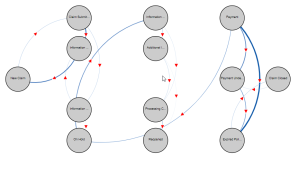
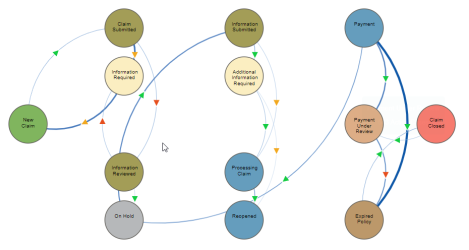
Most company’s have work flow processes where a piece of work is passed from department to department step by step until its marked as completed. Some processes are well defined, ridged and are simple to map out and others take on a more random path depending on their unique requirements, sometimes looping around the same department several times before it can be marked complete. Ideally I would have loved to work with a defined process where I could map data onto clear info-graphs (see below), perhaps the project will lead there, but for now I’m working with dynamic data.
Contenders:
- Network
- Sankey
- Chord
Each chart was visualized with example data to quickly see how they performed.
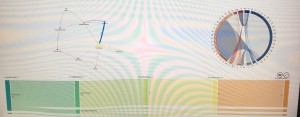
Sankey was eliminated as the process wasn’t fixed and there could be random loops…
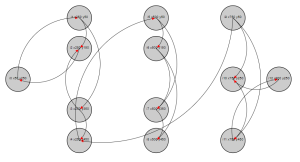
Chord diagram was difficult to analysis so the decision was made to use the Network Chart as the starting point although I needed to do more with it, I wanted the process to flow left to right from the open to closed action with all the work nodes in the middle. Off the shelf network charts used force to determine where a node would be positioned, this would be random and as such you couldn’t see the left to right flow as you were always looking for those start end end point. For this to work I decided to create a bespoke extension using D3.
Initial set of requirements
- Determine the position of the nodes and lock them in place
- Allow the user to move a node if required
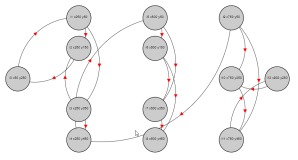
- Draw paths from each node
- Path thickness to indicate volume
- Arrow on path to indicate direction of travel
- RAG status of the directional arrows
- Fit the node name into the circle by wrapping the label
- Colour code the nodes by dimension
- Add PopUps for the nodes and RAG arrows
Development
First I used a basic Network Chart from Holtz Yan (https://www.d3-graph-gallery.com/graph/network_basic.html) to give me the basic building blocks. One issue which I didn’t notice was it used version 3 D3, the Network commands for V5 are different although as I was too far into the project before I realized I continued with version 3… This of course may cause a problem in the future if more requirements are added but for now its fine.
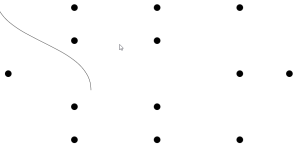
Next I started working through my requirements… I created a JSON file which held x and y coordinates of all the nodes (plus additional data), turned off the network force settings to lock them in place.
I changed the paths so they linked between the nodes and updated the code to allow the nodes to be moved by the user but still remain in their new position. For this turned back on the tick. removed the force and added this code to lock the position of the node.
(when appending the nodes)
.classed("fixed", function (d,i){d.fixed = true})
.call(drag)
function dragstart(d) {
  d3.select(this).classed("fixed", d.fixed = true);
}
    .data(graph.nodes)
    .enter()
    .append('foreignObject')
    .attr("class", "nodetext")
    .attr('style', 'display: flex;justify-content: center;align-items: center;text-align:center;vertical-align:middle;padding:2px;margin:2px;');

nodename = nodeposs.append('xhtml:p')
    .text(function(d){return d.Name;});
Future Development:
- Connect the visualization to Qlik Sense as an Extension
- Allow the user to resize the chart
- Allow the user to select objects and pass those selection to Qlik
- Add a further chart in the PopUps to show further information. For example a distribution chart on the RAG arrows.
Again any further ideas for development is very welcome.

