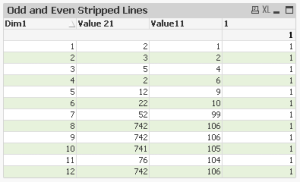
QlikView straight tables have an option in the Style Properties that adds a stripe every x rows. Very useful when you’re showing lots of detailed record information so the user has a visual cue they’re reading the same line.
You can create the same effect using Background Color property of the dimension and expressions. Why? I hear you ask.
You may want to group items together, for instance you may have a key dimension which you want to group together by way of colouring the lines:
This can be done simply, here my dimension has a corresponding numeric ID. If I insert the following code to the background colour property it will change the colour depending on if the ID is an odd number or even.
=if(Even(Dim1)=-1,argb(40,101,173,33))
This works to a point although what if the user has selected records so only the Even dimensionID’s are possible! Well all the lines will be coloured and that defeats the object of what we’re trying to achieve.
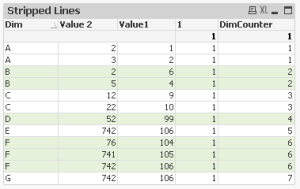
What we need to do is expand this concept by using a hidden expression called DimCounter, the basic syntax is:
If( isnull( Above ( Total DimensionID) ) =-1

          ,1

          ,If( above (Total DimensionID)) <> DimensionID

                  ,Above(total DimCounter)+1

                  ,Above(total DimCounter)

           )

)
What this expression is doing first is checking to see if it’s the first line of the chart, if it is then the DimCounter is set to 1
If not then we compare the previous DimensionID with the current rows value. If this is different (i.e. We have changed to a new DimensionID) then it takes the previous DimCounter value (which was 1) and adds 1 to it.
If the previous DimesionID is the same as the current then we just take the previous DimCounter number (which was 1).
We can now change the background color expression to:
=if(Even(DimCounter)=-1,argb(40,101,173,33))
You can expand the DimCounter expression to accept set analysis by using Only():
If( isnull( Above ( Total only( {<[SA Here>} DimensionID) )) =-1

     ,1

     ,If( above (Total only( {<[SA Here>} DimensionID))) <> only( {<[SA Here>} DimensionID)

          ,Above(total DimCounter)+1

          ,Above(total DimCounter)

     )
 )
I hope you’ve found this useful. I added more functionality (not shown here) to my final chart so I could suppress zero values and reduce the straight table results.
Richard


Nice trick!
When I want to do that kind of striping I usually go with something like =If(Even(aggr(NODISTINCT RowNo(), DimensionID)),argb(40,101,173,33))
Usually that’s enough to do the trick.
LikeLiked by 1 person
Hi Gysbert,
The simplified expression didn’t work in my chart, although I think that’s mainly due to the fact not all rows are showing. That’s one of the challenges I had when developing this. Thanks for commenting though as I’m sure others will find it useful.
Richard
LikeLike