Hello,
Recently I’ve been blogging about where to store variables and why (I think) a data island is the best way forward. The original idea for a data island comes from a technique for creating a chart that a user can define the dimensions and expressions by simply selecting from list boxes.
I’ve been using this technique for a couple of years (and a slightly different technique before) and now its a standard part to any dashboard development that I do. The power of such a chart is amazing for the end users and I always get a positive response when I demo such a tool. Once a customer simply said, “That’s it, that’s all I want”.
I’ve hung back on blogging about the technique for such a long time because it’s been done… https://community.qlik.com/docs/DOC-6046 is a good example by Jason Michaelides.
The reason I’ve broken my unwritten rule is because I’ve developed it further so expressions stored within a data island and my new As Of Calendar all work in harmony, I’ll come onto how that works in a later post but for context I’ll now explain the concept of a User Controlled QlikView Chart.
How it works
(The file I used can be found here)
The data structure is very simple. Two data islands (by that I mean not linked to your main dashboard data tables) that contain a list of Dimensions and Expressions. Both must have a sort order which is simple an incremental distinct number and the expression table must also have the expression.
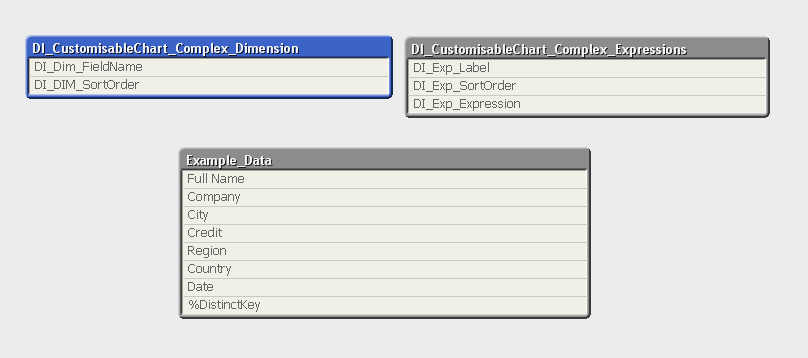
QlikView User Controlled Charts Data Structure
Note - My tables contain a lot more information such as Label, Help Text, Grouping, Etc but we'll not worry about that now.
Here’s the code to create the data islands:
DI_CustomisableChart_Complex_Dimension:
Load
‘[‘& DI_Dim_FieldName & ‘]’ AS DI_Dim_FieldName // Important to use [ & ] to surround the field name on the off chance they have spaces in them!!
,RowNo() AS DI_DIM_SortOrder;
Load * Inline [
DI_Dim_FieldName
Full Name
Company
City
Region
Country
Date
];
// Create Expressions, you can add formating and set analysis
DI_CustomisableChart_Complex_Expressions:
Load * Inline [
DI_Exp_Label ,DI_Exp_SortOrder ,DI_Exp_Expression
Total Credit ,1 ,”num(sum(Credit),’£#,###.##’)”
Highest Credit ,2 ,max(Credit)
Average Credit ,3 ,avg(Credit)
Average China Credit ,4 ,”avg({<Country={‘China’}>} Total Credit)”
];
On the dashboard add two ListBox’s for fields:
- DI_Dim_FieldName
- DI_Exp_Label
These are used to select which Dimensions and Expressions to use in the chart.
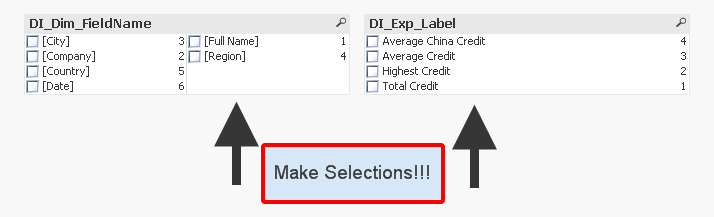
User Controlled Charts QlikView
The Magic of FirstSortedValue()
FirstSortedValue is such a powerful function in QlikView which is often overlooked and underused. It can by used like a vLookUp would in excel and if you’re clever with the SortOrder field you can pick any value from any field on the corresponding line. Here’s a good video explaining the function in detail.
Insert a chart and create a calculated dimension: =$(=FirstSortedValue(DI_Dim_FieldName,DI_DIM_SortOrder,1))
Then create 5 more:
- =$(=FirstSortedValue(DI_Dim_FieldName,DI_DIM_SortOrder,2))
- =$(=FirstSortedValue(DI_Dim_FieldName,DI_DIM_SortOrder,3))
- =$(=FirstSortedValue(DI_Dim_FieldName,DI_DIM_SortOrder,4))
- =$(=FirstSortedValue(DI_Dim_FieldName,DI_DIM_SortOrder,5))
- =$(=FirstSortedValue(DI_Dim_FieldName,DI_DIM_SortOrder,6))
You can see the only thing that is changing is the number at the end, increasing by one for each new dimension.
If we break down the function this is how is works: FirstSortedValue(DI_Dim_FieldName,DI_DIM_SortOrder,1)
| DI_Dim_FieldName | This will be the field value we return from the row we identify |
| DI_DIM_SortOrder | This field has to be numeric and unique (Decimals are ok) which will will check |
| 1 | Possible DI_DIM_SortOrder are organised into a list by QlikView, lowest to highest. This numbers defines which one to use (1 being the first / lowest) |
For example the possible values are:
| DI_DIM_SortOrder
3 5 6 |
DI_Dim_FieldName
CCCC DDDD EEEE |
- FirstSortedValue(DI_Dim_FieldName,DI_DIM_SortOrder,1)) would return CCCC
- FirstSortedValue(DI_Dim_FieldName,DI_DIM_SortOrder,2)) would return DDDD
- FirstSortedValue(DI_Dim_FieldName,DI_DIM_SortOrder,3)) would return EEEE
- FirstSortedValue(DI_Dim_FieldName,DI_DIM_SortOrder,4)) would return Null
So we can test the table now. Just create an expression with a definition of 1 then start selecting dimensions from your DI_Dim_FieldName list box!
For the expression create 7 (Changing the final number for each one)
- Definition: =$(=FirstSortedValue(DI_Expression,DI_SortOrder,1))
- Label:=FirstSortedValue(DI_FieldName,DI_SortOrder,1)
Again test the chart by selecting expressions from your DI_Exp_Label.
And your done!
You can improve this by adding conditional statements for both the Dimensions and Expressions (Remember to change the final number in the FirstSortedValue function for each one!)
- Dimension: if(FirstSortedValue(DI_Dim_FieldName,DI_DIM_SortOrder,1)<>Null(),1,0)=1
- Expression: if(FirstSortedValue(DI_Exp_Label,DI_Exp_SortOrder,1)<>Null(),1,0)=1
You can also use the same technique you used to create the expression label to add help text!!!
Have fun !!
Richard

Pingback: Where to store your expressions in QlikView? | qlikcentral·
Pingback: Storing Expressions Into a Data Island | qlikcentral·
Would it work, to declutter the expression text, to shove the long firstsortedvalue formulas into corresponding parameterised variables with the sort order as parameter? e.g. eExpressionLabel(1) instead of FirstSortedValue(DI_Exp_Label,DI_SortOrder,1)
LikeLike
Hi Elliot, I think that would work! Never used variables with attributes although can see how they would work here to simplify the expression.
Richard
LikeLike
Pingback: Automatically Create Point in Time Expressions | qlikcentral·