Hello,
Here’s a simple little QlikView trick which will make your Pop Ups really Pop Out and contain so much more information.
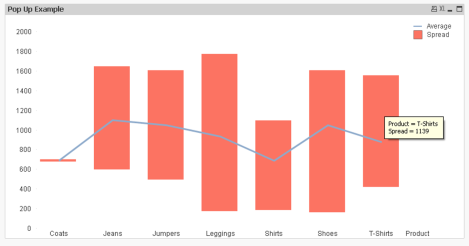
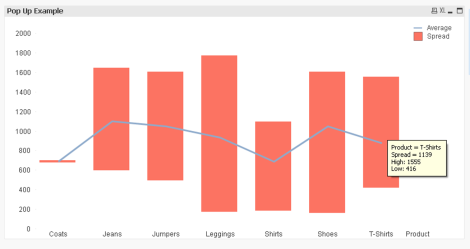
The example shows what you get by default in QlikView. Here I’ve created a combo chart which shows the average (line) and the Min / Max values are displayed in a bar with an offset, kind of like what you may see in Excel.
By hovering over the bar chart you can see its values (spread) but that’s not really the information you want. Really what you want to know is the Min and Max value. This can be done using a new QlikView expression and you’re not limited to the amount of information you can add into the pop up text box. This becomes really usful for this and other charts such as the Pie Chart. I tend not to use Pie Charts as I don’t think the information they give makes best use of the space they take up. That said by adding more information into the Pop Up text you can justify these charts more and more.
The technique.
- First create your expressions in the normal way and deselect ‘Text as Pop Up’
- Next create a new expression but deselect all display types such as Bar, Symbol, Line, etc (The image next to your expression should look like a speech bubble and Info Icon)
- Add all the text you want to display into this new expressions definition for example “=’High: ‘ & sum(High) & chr(10) & ‘Low: ‘ & sum(Low) “
- Now check ‘Text as Pop Up’ for this expression
I’ve placed an example QlikView file here on the Qlik Community for you to see it in action.
I hope this is helpful, would love to hear your comments.
Thanks
Richard


Can we do the same for Qlik Sense application as well. As i can’t find any familiar function in Qlik sense ..
LikeLike
Hi Ali. As far as I’m aware the only way to do that in. Sense is to use extensions. Not as daunting as you think, check out PicassoJS and CharJS for some good examples.
LikeLike