Hello,
QlikView allows users to easily apply totals to expressions in straight tables. New Qlik developers often do not fully understand this function and this can lead to data quality issues later on.
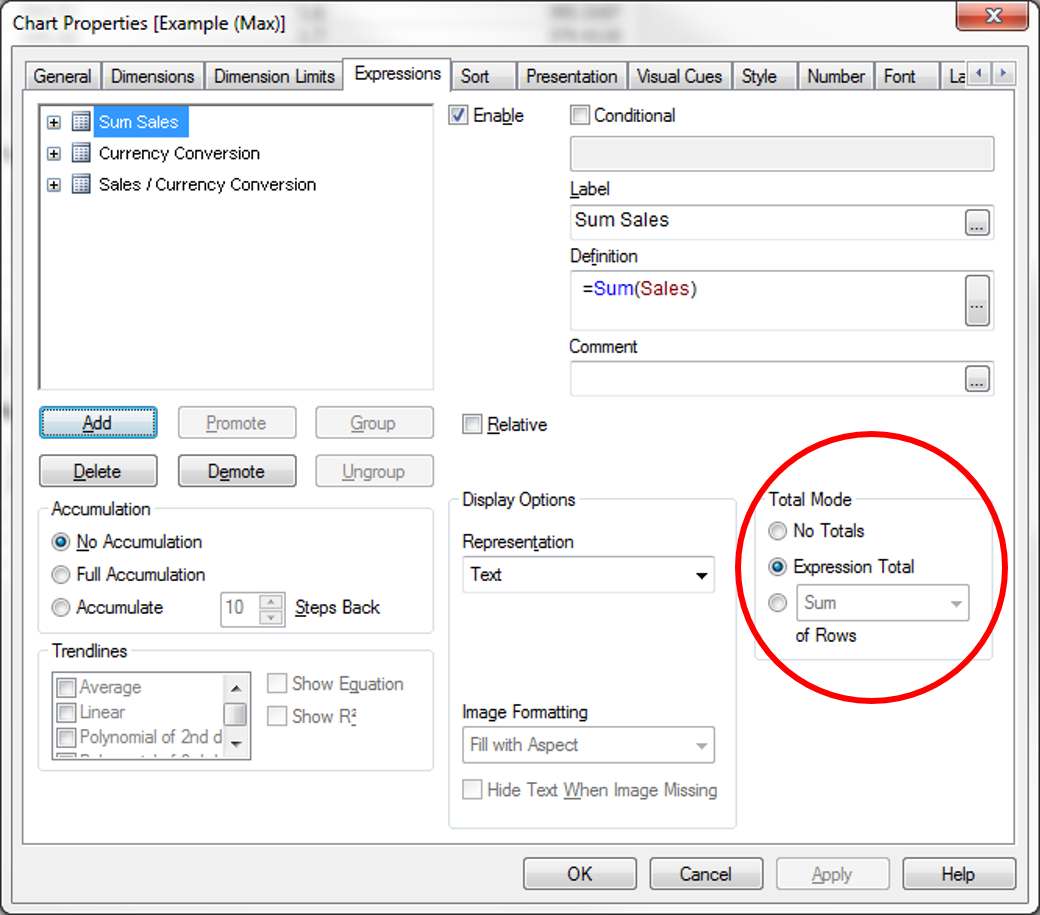
Qlik Chart Properties
It can be easily thought of as a sum of the rows. In the example above, the expression Sum(Sales) will show the total as most new comers to QlikView would expect (and it would be correct).
Problems occur when your QlikView dashboard applications inevitably become more complex. In this next example, each sale made to a specific country requires a conversion of currency.
100 in sales value to the UK isn’t the same value as 100 in sales to the US.

In this example we have three expressions:
- Sum(Sales)
- Max(Currency Conversion)
- Sum(Sales) / Max(Currency Conversion)
If we check the first line (Afghanistan) and calculate the currency converted value (744.08 / 1.55) we get the correct result: 480.0516. A quick scan of the chart and we believe all is ok.
Look again! The total (bold figure 3,267.3722) at the top can’t be the sum of the lines shown as it’s too small. So what’s going on?
A few months ago I read a great blog post (when I find the link I will post here) which talked about writing expressions in QlikView and how you must always write them with the total in mind.
If I now display the total for the Currency Conversion you’ll see the issue:

The Total Currency Conversion is wrong. In this example I used Max(Currency Conversion) which made perfect sense at the time because I knew each Country only had one possible value. This issue here is the Total row is taking the maximum possible value and using that in the calculation (5881.27 / 1.8).
The calculation QlikView is performing isn’t summing up the rows, instead its performing the calculation on the total row.
So what now? Well we can’t change it from Max to any other aggregation like Sum, Min, or Avg. The result would still be incorrect.
The best way to tackle the problem, now we have accepted the total function doesn’t work how we expected, is to imagine you only have the total row to work with. Thinking QlikView will respect the dimensions in the chart is throwing us off the scent and as I mentioned earlier we have to write an expression with the total in mind.
To force QlikView to respect the dimensions we use the Aggr() function. This works by effectively creating a temporary table in QlikViews memory from which a correct total can be sourced.
Sum ( Aggr( Sum(Sales) / Max(Currency Conversion ) , Country ) )
Think of this expression like a load statement (I’ve colour coded the various parts):
Load
Sum(Sales) / Max(Currency Conversion) AS ExpressionValue
Resident [Data]
Group by Country
We’re then summing all of the Expression Value’s in this new temporary table, as you can see below the total is now correct.

So far so good but what if we change the dimension in the chart from Country to Month?

QlikView Straight Table Totals
Here the total is correct but what’s going on in May and June? For these months we have no Sales / Currency Conversion values and this can be right because we can clearly see sales for those months.
To show what’s going on first I will add back in Country as a dimension and for ease select a single county:

QlikView Straight Table Aggr Function
We know the total is correct and interestingly July has the same value (which isn’t right) with May’s being zero (also not right).
QlikView knows what value Andorra should have but because the entries are split over two months, and QlikView doesn’t have that information in the temporary table we built earlier using the aggr() function, QlikView doesn’t know what to do.
We need to expand the aggregated expression to include Month !
Sum ( Aggr( Sum(Sales) / Max(Currency Conversion ) , Country, Month ) )

QlikView Straight Table Aggr Function Correct!
Now QlikView knows where to allocate the values and the chart calculates correctly. We can now remove the Country dimension from the chart and it will continue to work.

QlikView Straight Table Aggr Function Final
Final Thoughts:
- Write Expressions With Totals in Mind
- When using Aggr() make sure the “temporary table” contains all the information the chart needs
I hope you have found this useful. I’d love you hear your comments about this post or ideas for furture posts.
Happy Qliking!
Richard
Here are other posts referring to aggregation

Is it possible to get the .qvw related to this post?
LikeLike
Hi Jeremy. Sorry I don’t think I have it anymore. Rich
LikeLike