What’s the point? I mean when you think about it Qlik Sense the product has everything you need. Loads more charts, you can even make the paths on Line Charts thicker if you want. So why oh why would you use extensions?
Extensions are bad!
- They need to be supported
- They run the risk of breaking when a new version of Qlik Sense comes out.
- They add little value
Okay, anyone who knows me is aware I don’t believe those statements although I still hear them in organizations now. There are still people who don’t want anyone to explore this side of the Qlik platform which is available to us. Is this reluctance due to not understanding, have they heard bad things from other people which has stuck or simply do they not see the benefit?
So lets address some of the points above and I’m going to focus on the visualization extensions here…
They need to be supported!
Yes they do… so does everything. Your SQL server, your qlik ETL, your dashboards.
However extensions use common web technologies (html, JavaScript, css & SVG’s) many more people possess those skills than Qlik (ask any recruiter). When you first view an extension it can look complex but once you understand the structure they’re actually quite simple.
They run the risk of breaking when a new version of Qlik Sense comes out.
Yes they do… so does everything. Your SQL server, your qlik ETL, your dashboards.
If the business change an underlying system then the data which flows will break and need fixing. The same is true with qlik sense extensions. Each version may contain API that have deprecated (put at risk of change) or been removed (following depreciation).
However lets put that risk into context. Qlik Sense visualization extensions use three API’s (Extension API, Backend API, Capability API), You can can see the version history of each in the API help section.
Looking at each section the last time an API was deprecated was in November 2017 so at the time of writing around 4 and a half years ago (and counting). Further more the change was to global.getProductVersion hardly an API change that would affect many people.
This concern came about around v2 (c2015). Sense was still a baby after just being released in 2014 and a number of changes were seen in the Capability API. Qlik took onboard feedback following its general release and made the appropriate changes. Since then we’ve moved into calmer waters although the perception has stuck. There have been some who have continued to push the narrative as it helps them sell their supported extensions…
How many need to be monitored then I hear you ask.. Well a typical Qlik Sense visualization will have as little as three Qlik API calls… So lets look at them in detail
- Paint: introduced v1 (2015) no changes / stable: Qlik API Documentation
-
Resize: introduced v2 (2016) no changes / stable: Qlik API Documentation
-
selectValues: introduced v1 (2015) no changes / stable: Qlik API Documentation
So is Qlik Sense unstable? Not really, quite the opposite!
They add little value
Quite the opposite! They add loads of value if implemented correctly.
Time for a real life analogy:
” Years ago I completed a short Qlik contract for a whisky company. I was asked if I would like a tour of their bottling plant. Of course (hopeful of a free sample).
They showed me the production line. Bottles would move automatically from each machine; filled up, top screwed on, label attached, packed.. You get the idea. It was important this production line would efficiently and there were no blockages.
‘What’s in that other room back there?’, I asked
‘Well that’s where the really expensive bottles are put together, they can be £1,000 and upwards!’. I couldn’t see any production line, just people busy producing the top quality bottles of Whiskey.. Of course I asked what made them so expensive. Was the whisky aged in barrels for 100 years or more.
Surprisingly not. Its exactly the same whisky as what on the production line. It the bottles that are different. Very fancy bottles! “
The lesson here is some customers need the fancy (not all but some). These customers could include senior exec’s, customers, partners, shareholders and customers who just have those special requirements.
Extensions allow you to move away from the abstract constraints of the predetermined charts, or perhaps you need functionality that isn’t there. That’s when you would leverage extensions. Those opportunities present themselves all the time, people don’t always see them.
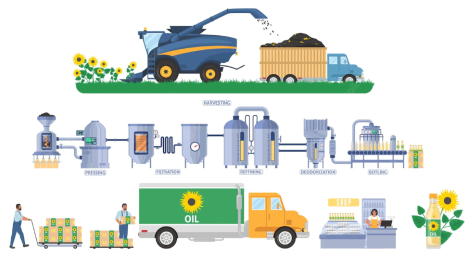
An example could be a business process or a production line. These are usually very bespoke to your operation and as such don’t fit the ‘off the self’ solutions. Network Chart, Sanky, Chord .. None of them really give you the cognitive view you’re after. We could produce an infographic (shown below) and add data indicators (Numbers, Arrows, Traffic Lights etc.) to it (not shown)…
Another example would be missing functionality. Perhaps to tell a story you just want the min and max data values adding to a line chart or maybe you want to add annotation. Extensions to the rescue!
I hope this answers some questions around extensions and their place in the data world!
Would love to hear your thoughts and experiences on the subject.!

