Hello,
I was once asked in an interview what my favourite QlikView functions were. My answer didn’t seem to be what they expected, the people asking the question thought the Peek function was one of the best but I stood firm.
I like text functions; Left, Mid, Right, Index, Replace, Substring, etc.
I was even told at this point that these functions are old and not as new as their preferred Peek. I did point out that Peek was available on my first computer (ZX Spectrum)

(The command is there!!!)
The reason I bring this up is because you can do so much with text functions. Here I will use the index function to highlight bars in a bar chart
Charts allow users to select information in QlikView. Click on a bar and the data reduces. We don’t want this to happen here and we shall use set analysis to keep the chart displaying all the bars.
The expression sum({<Month=>}[Purchase Price]) would still show all the months data within the data set even when the user has selected a single month
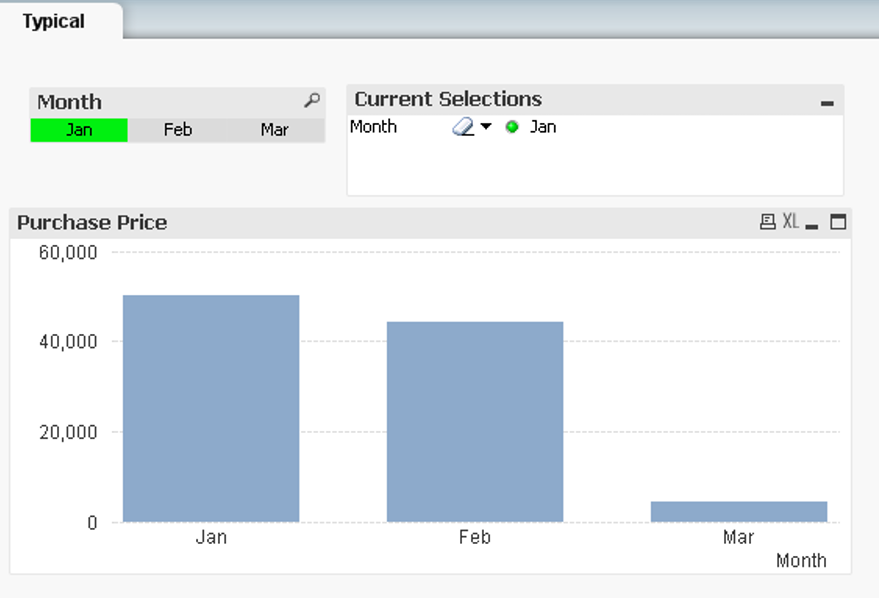
QlikView Bar Chart
This works well although I want to make it clear to the user that the Month of Jan has been selected, the chart will help me with this as its big, bold, and prominent! By changing the colour of the bars to match the months that have been selected it will be a great visual cue.
Each expression has a number of additional attributes you can modify. We want to change the background colour:

QlikView Expression Properties
What we need to do is check if the chart dimension matches the values selected in the Month field. The function GetFieldSelections(Month) will return the selected values of Month so the formula becomes very simple; if(GetFieldSelections(Month)=Month,green()) .
This works well when a single month is selected. If ‘Jan’ is selected GetFieldSelections(Month) will return ‘Jan’. The conditional requirement is met and we change the background colour to green.
Unfortunately this doesn’t work if two or more values are selected. If the user has selected Jan & Feb then GetFieldSelections(Month) will return ‘Jan,Feb’ which won’t work. What we need to do is to get QlikView reading the text for the occurrence of either Jan or Feb. One of the ways this can be achieved is by using the Index() function.
Index(1,2,3) has three attributes.
- The text you will read
- The text you want to find
- The starting point which you will read from (Optional – if left out it will read from the beginning)
What you get back is a number which is the starting position of the first instance of the text you were looking for or zero if the text wasn’t found. For example Index(‘Jan,Feb’,’Feb’) will return 5 and Index(‘Jan,Feb’,’Mar’) will return 0 (zero).
So now rather than looking for a specific month we can use this function to be either =0 (not found) or >0 (found).

QlikView Bar Chart Expression Background Properties
Here the background properties uses the expression: =if(index(GetFieldSelections(Month),Month)>0,green())
I hope this has been useful, look forward to hearing your comments.
Happy Qliking
Richard

Thanks Richard. Who asked that question 😉
LikeLike
:-). That would be telling DV 😉
LikeLike
Hi Richard,
instead of the combination of GetFieldSelection() and Index() I prefer to use the following expression:
if(GetSelectedCount(Month)>0 and Month=Month,green())
The first part handles the case when no selection is made, and the condition Month=Month checks what’s been selected.
Although I have never figured out how it works (it looks to me that the condition should be true even for non-selected months), it works anyway! On the benefits side, it would work correctly if two dimension values are very similar, e.g. one dimension value is a substring on the other dimension value, as the comparison uses exact values, whereas Index(GetFieldSelection()) would not be 100% correct in such cases.
Cheers,
Andrey
LikeLiked by 1 person
Hi Andrey,
Wow thanks for this. You’re absolutely right, my way would have an issue where the string searched for was contained in another substring.
I have, so far, only used this for months and similar fields such as year, qtr, etc. so I know I was safe..
I guess Month=Month works due to fact the chart is analysing each dimension so it returns a value for each one even when multiple months are selected.
The idea of the blog post was to explore text commands, something I enjoy using.
This alternative way you’ve shown to resolve the example I used is very useful !!!!!
Cheers
Richard
LikeLike
Pingback: How to change the color of a Bar in QlikView based on user selection | thepintelligencegroup.com·
Helloo i tried it but it doesn’t work for me. Please can you help ?
LikeLike
Can you supply any more information?
LikeLike
https://community.qlik.com/thread/273762?sr=inbox&ru=171708
LikeLike
in case i have many columns and i don’t want them to disappear just the selected one to be colored…
LikeLike